|
|
Tutorial: Specials Reports |
|
|
Tutorial: Specials Reports |
Items can be placed on special in the Inventory Management Specials screen in order to promote their sale by giving customers a cheaper price for the item. The Portal provides some reports that outline the statistics of your specials. In this tutorial we will investigate the reporting facilities available to investigate the movement of items on special.
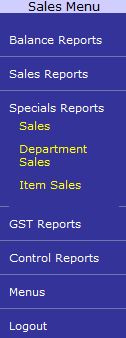
This tutorial discusses the Specials Reports section of the Sales Menu. The Sales Menu can be opened by selecting the Menus and Sales Menu links from the Navigation Menu. Open the Specials Reports section by clicking on the Specials Reports link.
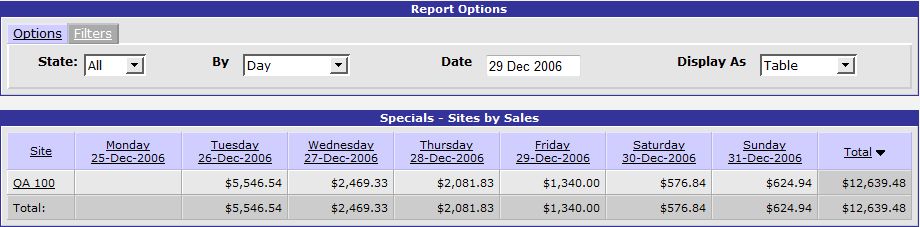
The Sales link in the Specials Reports section of the Sales Menu opens the Site Sales Specials report. This report provides statistics on items that are on special at a selected Site during the specified period. Use the Display As drop-down list to select to view the data in a table or a line, pie or bar chart. The Filters tab contains a Type drop-down list to allow you to select the type of data displayed in the report - sales figures, dollars per kilogram or units per customer, for example. Click a Site Name link to drill down to the Department Sales Specials report, filtered by the selected Site.
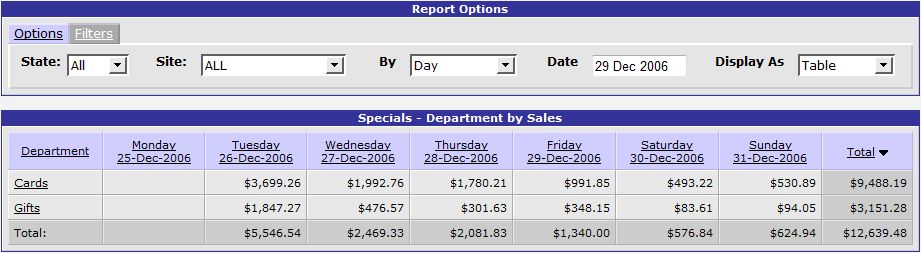
The Department Sales Specials report can be accessed from the Specials Reports section of the Sales Menu. This report provides details of items on special in the selected Site and/or State during the specified period, grouped by Department. Use the Display As drop-down list to view the report data in tabular or graphical format. In the Filters tab, select the Type of data to be displayed in the report - sales figures, cost per customer or profit, for example. Click on a Department Name to open the Item Sales Specials report for the selected Department.
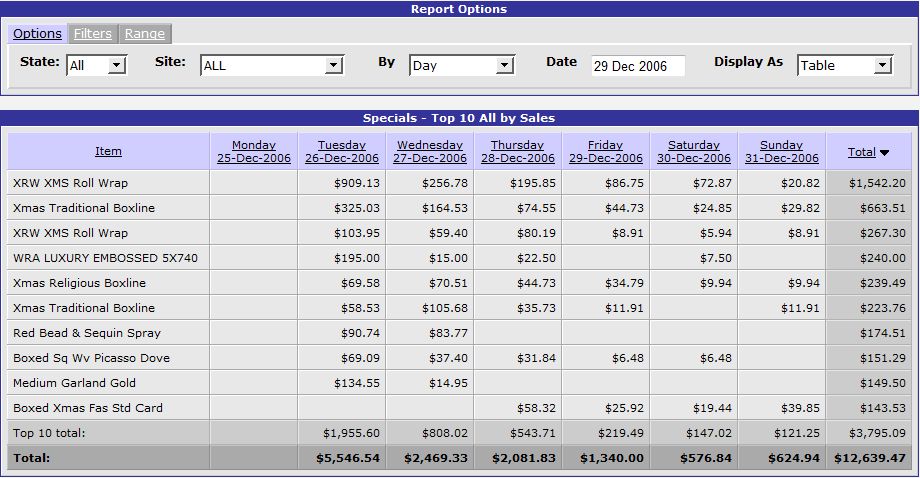
The Item Sales link in the Specials Reports section of the Sales Menu opens the Item Sales Specials report. This report outlines data involving the items on special at a selected Site and/or State during the specified period. The Display As drop-down list allows you to view the data in the report in a table or as a line, pie or bar chart. The Filters tab contains a drop-down list to allow you to select the Type of data displayed in the report - sales figures, dollars per unit or cost per customer, for example. There is also a Range tab for this report that allows you to filter the report by Department and select the number of items to Display in the report - the Top 10 performers, for example.
In this tutorial we have looked at the Specials Reports section of the Sales Menu. These reports can be used to identify the success of specials in your Sites and to report on the sales figures during specials periods.